
The inflation number everyone celebrated — and what it may be missing
Monday I wrote that this could be one of the biggest market weeks of the summer.
Three of the major catalysts have now landed: CPI, PPI and the first wave of bank earnings.
The reports were encouraging. They were also backward-looking.
CPI came in cool—genuinely cool
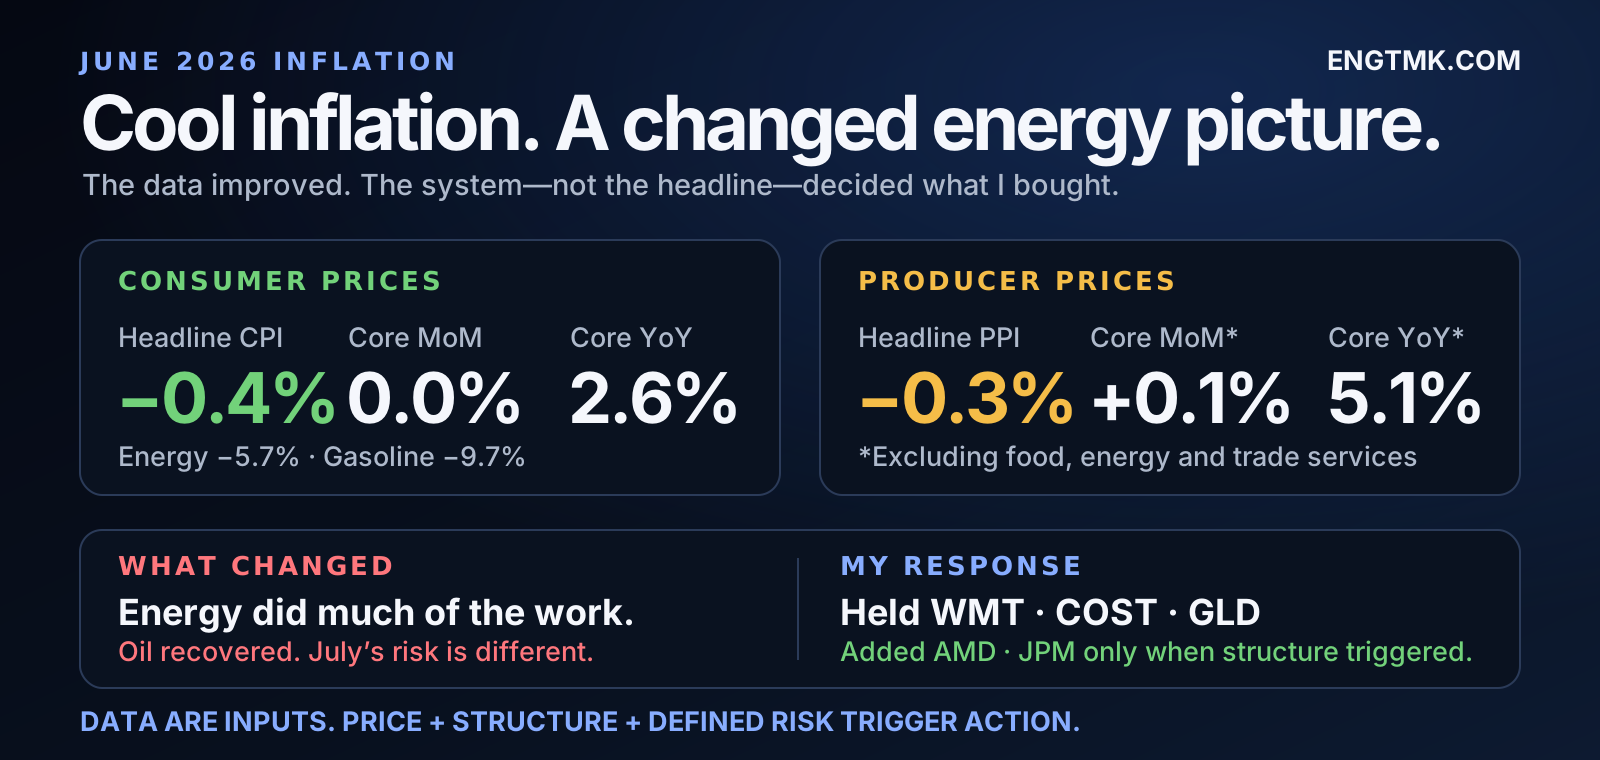
The Bureau of Labor Statistics reported that headline CPI fell 0.4% in June, the largest monthly decline since April 2020.
The annual rate slowed to 3.5%, down from 4.2% in May. Core inflation, excluding food and energy, was unchanged for the month and slowed to 2.6% year over year.
That is real progress. Core inflation cooling should not be dismissed.
Markets responded accordingly: Treasury yields fell, the dollar weakened and expectations for an immediate Fed hike moved lower.
But the composition matters.
Energy did much of the work
The energy index fell 5.7% in June. Gasoline fell 9.7%.
That decline was large enough to more than offset increases in food and shelter, making energy the biggest contributor to the headline improvement.
June was also the month when the temporary U.S.–Iran ceasefire was holding and oil prices were falling.
That is no longer the same backdrop.
Renewed conflict and pressure around the Strait of Hormuz pushed Brent crude back toward $80 after it had fallen to roughly $67 earlier in July. Those changed energy conditions are not present in June CPI; if they persist, they will appear in future inflation data with a delay.
So the right conclusion is not that the CPI report was misleading. The right conclusion is that it accurately described June—not necessarily the environment that followed it.
PPI added the missing layer
The June Producer Price Index fell 0.3%, again with substantial help from energy. Final-demand energy prices dropped 6.4%, while gasoline prices at the producer level fell 12%.
But the measure excluding food, energy and trade services still rose 0.1% for the month and 5.1% over the year.
That gives us a more complete picture:
- Energy provided major relief.
- Consumer-level core inflation improved.
- Underlying producer-price pressure did not disappear.
- July’s energy environment is already different from June’s.
There is no reason to panic over that combination. There is also no reason to declare victory after one favorable report.
The banks were strong—but they show only part of the consumer
The first major bank results were also better than expected.
JPMorgan reported record quarterly profit, supported by stronger dealmaking and trading activity. Goldman Sachs also delivered a sharp rise in earnings as equity trading and investment banking accelerated.
Credit quality at the major banks remained stable, which supports the argument that the prime consumer is still resilient.
But large banks tend to serve higher-quality borrowers. Their results do not prove that every household is equally healthy, particularly at the lower-income end of the credit spectrum.
The bank reports tell us an important part of the story—not the whole story.
What this changed for my portfolio
Nothing in CPI or PPI automatically creates an entry.
I do not buy because inflation was better than expected. I do not sell because oil moved higher. Those are inputs, not trade signals.
This week, I participated only where price and structure produced a defined setup.
Existing zone positions
On eToro, I re-entered WMT at 115.29 after price returned to the demand area, with the stop kept below the zone floor.
COST and GLD were already-open mirrored positions when their fresh demand-zone signals appeared; they were not new purchases today.
- COST: 3 shares in IBKR and approximately $400 on eToro, with the stop at 896.86.
- GLD: 7 shares in IBKR and approximately $375 on eToro, with the stop at 359.38.
The fresh signals supported the existing thesis, but I did not need to treat every repeated signal as a separate new trade.
Two new entries
AMD and JPM were the new fourth and fifth entries of the week, and I entered both in my IBKR and eToro accounts.
AMD — MA20 reclaim
AMD reclaimed its 20-day moving average while remaining in a strong uptrend on both timeframes.
- IBKR: 5 shares at an average of 540.34
- eToro: approximately $400 at 541.28
- Stop: 507.98
- Reference reward to risk: approximately 2.7R
JPM — post-earnings breakout
JPM broke above 341.91 after earnings, creating a breakout setup.
- IBKR: 8 shares at an average of 346.56
- eToro: approximately $400 at 346.12
- Stop: 338.06
- Reference reward to risk: approximately 4.8R
The JPM stop is about 2.5% below my IBKR fill. That is still relatively tight for a post-earnings trade and leaves the position exposed to normal price noise.
A high theoretical reward-to-risk ratio does not automatically make a trade safer.
Five entries still equal one portfolio
This was the fifth entry of the week.
That matters.
A setup can be valid on its own and still add too much combined exposure when several trades trigger close together. Position sizing, correlation and total portfolio risk must be managed across the whole book—not one chart at a time.
That is the difference between reacting to headlines and executing a system.
CPI does not move my zones.
PPI does not move them.
Brent crude does not move them.
Price reaching a defined level—with structure, a stop and a target—is what makes me act.
Most of my eToro account remains in cash.
Participating selectively. Not chasing.
This is a record of my process, not investment advice. Copy trading involves risk, including loss of capital. Past performance is not an indication of future results.