
Inflation week—and the calendar is playing a trick on us
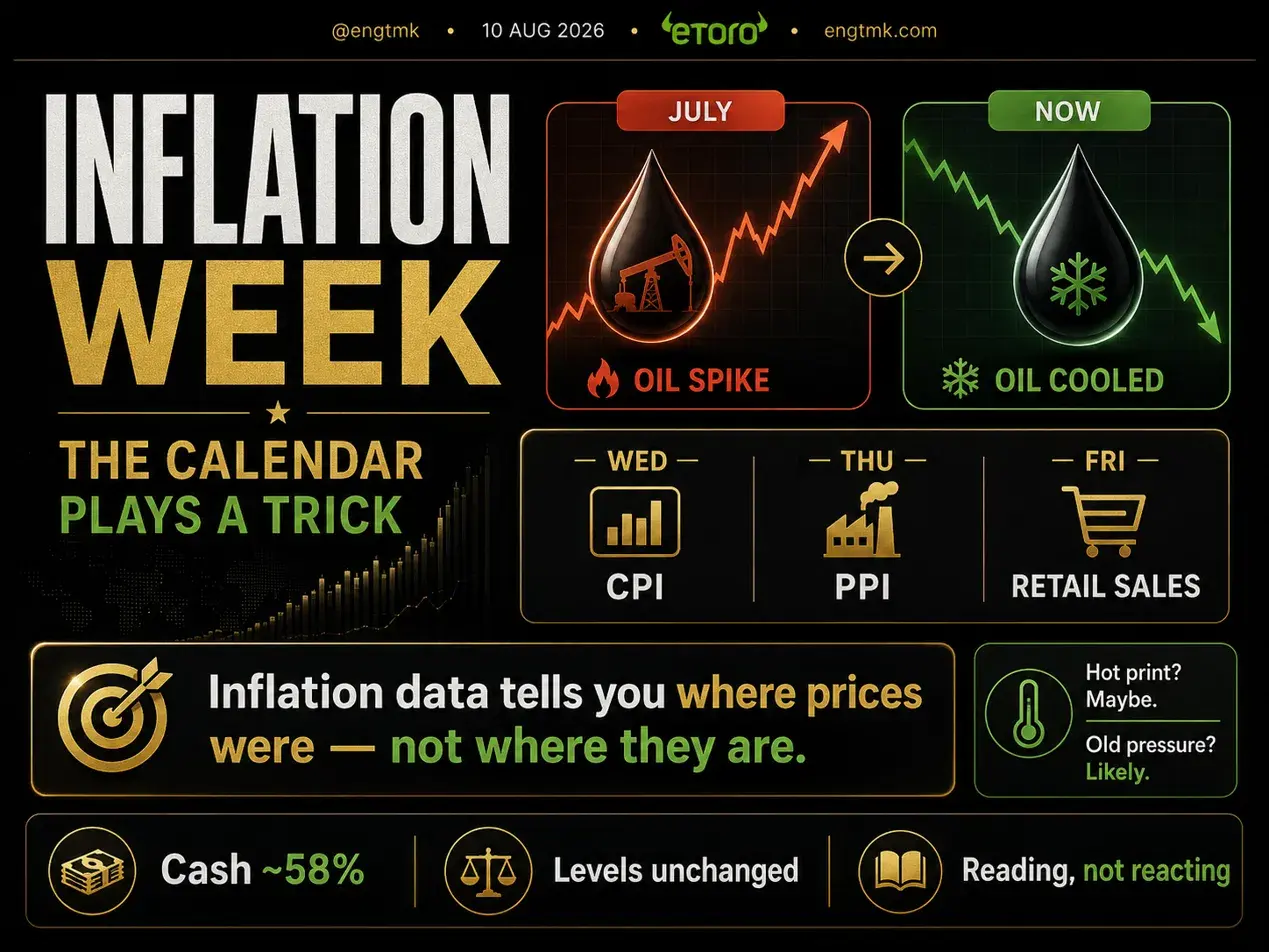
Inflation week is here.
The calendar is playing a trick on us.
Markets finished last week near record highs after strong earnings and a weaker jobs report reduced part of the pressure for another Federal Reserve hike.
Now three July reports arrive in three days:
- Wednesday, 12 August: Consumer Price Index
- Thursday, 13 August: Producer Price Index
- Friday, 14 August: Advance retail sales
Every release is scheduled for 8:30 a.m. ET. BLS 2026 release calendar · Census Bureau retail schedule
The dates are current.
The information is not.
All three reports describe July.
Wednesday measures a month that has already changed
July included another escalation in the US–Iran conflict and a sharp increase in oil.
Brent crude moved above $95 on 22 July as attacks and threats to Middle Eastern shipping intensified.
By 4 August, Brent had fallen to $79.36 as diplomatic hopes improved. It has since rebounded toward the mid-$80s as optimism about reopening the Strait of Hormuz weakened.
The pressure has therefore not disappeared.
But the price path facing markets today is materially different from the late-July peak. Reuters on the July spike · Reuters on the August decline
That creates the timing problem.
Wednesday’s CPI can contain evidence of an energy shock that has already partly reversed by the time investors receive the report.
Last month, the direction was reversed.
June CPI benefited from softer energy conditions measured before the next oil escalation. By publication day, the market was reading a cooler month while the live commodity backdrop had already become more inflationary.
This week may deliver the mirror image:
A firmer backward-looking number beside a cooler current energy path.
That possibility is real.
It is not permission to dismiss the report.
CPI is not the closing price of oil
The clean story—oil rose in July, therefore CPI must be hot—is too simple.
The CPI measures prices paid by urban consumers for a broad basket of goods and services.
Prices are collected through the month rather than at one instant. The BLS divides the month into three pricing periods, and gasoline uses millions of daily price observations from a secondary data source.
The monthly gasoline index therefore corresponds to prices across the calendar month, not Brent crude on 22 July or the price at one filling station.
Motor fuel represented roughly 3% of CPI weight as of December 2025.
Shelter, food, medical services, insurance and other categories can easily change the composition of the result.
The correct claim is narrower:
July’s energy shock may raise the measured inflation pressure even though part of that shock has subsequently reversed.
That is a timing observation.
It is not a prediction of the headline number. BLS CPI concepts · BLS motor-fuel methodology
Three releases, three different questions
The week’s reports are often discussed as one “inflation package.”
They measure different things.
THE JULY DATA PIPELINE
The release date is current. The observation period is July.
Each report supplies a different piece of the rates-and-earnings argument.
What urban consumers paid across July. The market will separate headline energy effects from core persistence.
What domestic producers received. It can inform margin and pipeline pressure, but it does not map mechanically into CPI.
How much consumers spent at retailers and food services. A higher total can reflect volume, prices or both.
CPI asks about the consumer price level
The market will focus on both headline and core inflation.
Headline CPI includes food and energy and is more exposed to the July commodity shock.
Core CPI removes food and energy, but it is not automatically “clean.” Shelter and service categories can remain persistent even after oil falls.
PPI asks about producer revenue prices
PPI measures the change in selling prices received by domestic producers.
It can reveal cost and margin pressure earlier in parts of the supply chain.
It is not a simple preview of next month’s CPI. The baskets, weights and concepts differ, and companies can absorb, delay or amplify cost changes.
Retail sales asks about nominal demand
The advance retail-sales report is not adjusted for price changes.
A strong number may mean consumers bought more units.
It may also mean they paid more for the same basket.
The market will have to read Friday’s spending total beside Wednesday’s inflation result before deciding how much real demand actually improved.
Backward-looking does not mean useless
Investors often make one of two mistakes with lagged data.
The first is treating the release as a live photograph of the economy.
The second is dismissing it because the observation period has ended.
Both are wrong.
July CPI still matters because it can change:
- The inflation trend
- The Federal Reserve’s confidence
- Treasury yields
- Real household purchasing power
- Corporate input and wage assumptions
- Market expectations for September and later meetings
The fact that oil has moved since July does not erase the prices consumers paid during July.
It changes how that evidence should be projected forward.
Backward-looking data is evidence about the path—not a timestamped instruction about the present.
The market trades the decomposition
The headline reaction will not depend only on whether CPI is above or below one consensus estimate.
Investors will ask:
- How much came from energy?
- Did shelter continue cooling or reaccelerate?
- Were service prices broad or concentrated?
- What happened to goods inflation?
- Did the monthly core pace change?
- Does the current oil path confirm or reverse the July impulse?
- What does the combination imply for the Fed?
Two equally hot headline numbers can produce different market reactions.
A report driven by a reversible energy spike is not the same as one driven by persistent shelter and services.
A cooler headline with sticky core services is not the same as broad disinflation.
The number matters.
Its composition matters more.
Last week supplied the same lesson through earnings
Shopify and AMD reported strong operating results.
The market treated them differently.
Shopify revenue grew 34%, gross merchandise volume rose 32%, and free-cash-flow margin reached 18%. Management guided to low-thirties revenue growth for the third quarter, and the stock gained roughly 18% as the evidence reduced fears that AI would weaken the platform. Shopify Q2 results · MarketWatch reaction
AMD reported record revenue of $11.54 billion. Data Center revenue rose 107% to $6.7 billion.
The stock still fell because the operating evidence did not clear the expectations already embedded in the price. AMD Q2 results
The connection to inflation week is direct.
Data never arrives alone.
It arrives against:
- Expectations
- Positioning
- Valuation
- The current price path
- The next policy decision
- The quality and composition of the evidence
Beats do not matter by themselves. Evidence versus expectations does.
What would change the interpretation?
A hot headline led by energy
The initial reaction could still be negative because yields may rise.
But investors may discount part of the move if the current energy path remains below July’s peak and core categories cool.
A hot core report
Persistent shelter or services would be harder to dismiss as a calendar effect.
That would challenge the rate relief created by last Friday’s weak payroll report.
A cool report
Lower inflation would support the soft-landing interpretation—particularly if retail sales later show that demand remains resilient.
But a cool number caused by collapsing demand would eventually create a different earnings question.
Hot inflation and weak retail sales
This would be the least comfortable combination.
It would suggest weaker real demand without giving the Fed an easy path to support growth.
One release does not define the regime.
The sequence does.
What I am doing into the data
No new position is being opened simply because the calendar is busy.
Cash remains around 58%.
The July deployment remains in place.
The marked levels remain unchanged.
If a hot inflation report pushes yields higher and drags qualified companies toward valid zones, the system can evaluate the prices created by that reaction.
That is different from predicting the print.
It is also different from automatically adding to a winning position because it becomes cheaper for one morning.
Any addition still needs its own setup, risk budget and prewritten condition. That distinction is developed in Lesson 26: Adding to winners without chasing them.
The release can move price.
It cannot waive the entry rules.
The larger lesson
Economic releases arrive with a built-in delay.
Markets do not.
Wednesday’s CPI will tell us what happened to consumer prices through July.
Oil will tell us what the energy market believes now.
Treasury yields will tell us how investors connect both pieces to future policy.
Stocks will tell us whether the change in discount rates matters more than the change in expected earnings.
No single signal owns the whole answer.
The disciplined response is to separate:
- What period the data measures
- What changed after that period
- Which components drove the result
- What the market expected
- Whether the portfolio rules changed
Inflation data tells us where prices were.
The live market tells us what investors think comes next.
The process decides whether either one authorizes a trade.
Read the release. Reconcile the timeline. Do not trade the headline alone.
This is a record of my process and opinions, not investment advice. I hold positions in securities mentioned or related. Copy trading involves risk, including loss of capital. Past performance is not an indication of future results.