Hotter inflation. No simple gold signal.
By @engtmk · Research as of 14 October 2026
On 30 September, I questioned whether softer inflation was a lasting change for gold. Today’s CPI complicates that question. Inflation concern can support demand for gold, but a stronger interest-rate response can increase the return available elsewhere.
This expands today’s eToro post. The argument is not that hotter inflation automatically helps or hurts GLD. It is that the inflation evidence and the opportunity cost of holding gold must be examined together. The latest data make both sides of that test more important.
What September’s CPI actually says
The Bureau of Labor Statistics release, published 14 October at 8:30 a.m. Eastern Time, covers September 2026. These are measured outcomes, not forecasts. Monthly changes below are seasonally adjusted; annual changes are unadjusted comparisons with September 2025.
| CPI measure | September monthly change | September annual change |
|---|---|---|
| All items | 0.6% | 3.7% |
| All items excluding food and energy | 0.3% | 2.6% |
| Energy | 5.2% | 20.4% |
| Gasoline | 9.1% | 34.2% |
BLS attributes more than half of the monthly all-items increase to gasoline. Shelter rose 0.4%, following 0.3% in August. Annual core inflation increased from 2.4% to 2.6%, a 0.2-percentage-point change. Monthly core remained at 0.3%.
That last distinction matters: annual acceleration does not mean the monthly core rate accelerated. These observations describe different comparison windows. They also argue against treating the report as entirely a fuel story.
A gap is not a contribution calculation
The annual headline/core difference is 1.1 percentage points, calculated as 3.7 minus 2.6. That gap highlights why the two measures tell different stories, but it is not a calculation of energy’s contribution. Core excludes food as well as energy and uses a different basket. Contribution analysis needs the relevant component weights and index methodology.
Similarly, gasoline’s annual increase does not mean prices jumped by that amount during September. Its monthly and annual figures measure different intervals. Neither can be substituted for the other to explain the latest release.
The connection with September’s fuel-and-retail research is analytical: headline aggregates can conceal important differences underneath. Here, the appropriate response is to separate the volatile components from broader pressure, then ask how policy and investors respond. It is not to assume that one impressive number settles the investment case.
Rate pricing has moved, but keep the comparison honest
The CME FedWatch tool provides a current market-implied snapshot for the 28 October decision. At 11:05:43 a.m. Central Time on 14 October (12:05:43 p.m. Eastern; 16:05:43 UTC), it showed:
- 41.5% probability for a 4.00%–4.25% target range, compared with 22.1% in its 13 October daily comparison.
- 58.5% for 3.75%–4.00%, compared with 77.9% in that previous-day comparison.
The calculated change in the higher-range probability is 19.4 percentage points. A hold remained the majority outcome in this snapshot. These are futures-implied probabilities, not the Federal Reserve’s forecast or a commitment, and they can change before publication or the meeting.
The current observation is after the CPI release; the comparison is the tool’s previous-day observation, not a tick immediately before the release. It supports saying that pricing differs from the prior day. It does not isolate CPI as the sole cause of the change or establish the exact immediate announcement reaction.
No primary-source, time-matched consensus poll is used here, so this article does not label the CPI figures a beat or miss. Nor does it assert an intraday gold return without a verified, timestamped comparison. A framework should not masquerade as a measured market reaction.
Why the GLD question has two sides
State Street describes GLD as exposure to gold bullion’s price less expenses. Its gross expense ratio is 0.40% annually. Gold does not generate interest income; owning exposure through a fund does not turn it into a yield-producing business.
The supportive argument is that concern about purchasing power or confidence in policy can increase demand for gold. The counterargument is opportunity cost: higher inflation-adjusted bond yields can make an asset without income less attractive. The dollar and other sources of demand can also matter. This is a set of competing channels, not a mechanical pricing formula.
The World Gold Council’s interest-rate analysis cautions against reducing gold’s behaviour to a single rate relationship. That is useful context, rather than proof of what gold will do next.
A nominal policy-rate change is also not the same thing as a real-yield change. Real yields reflect inflation-adjusted returns; expectations and the maturity being examined matter. Subtracting today’s annual CPI from an unrelated market yield would not produce a clean forward-looking measure. The relevant test is the actual movement in comparable real yields, alongside the dollar and gold demand.
Three scenarios worth testing
| Scenario | Evidence that would support it | Evidence that would challenge it |
|---|---|---|
| Inflation concern dominates | Persistent inflation concern accompanied by stronger gold demand | Higher real yields and weaker demand despite the inflation news |
| Opportunity cost dominates | Sustained increases in real yields and a firmer dollar | Gold demand remains resilient despite those pressures |
| The latest shock fades | Later inflation data moderate and expected tightening eases | Broader inflation persistence and a stronger policy response |
These are conditional scenarios, not forecasts or assigned probabilities. The CME probabilities refer to a particular policy decision, not the likelihood of any gold-price outcome in this table. An investor can be right about inflation and still be wrong about the asset-price response if expectations, yields or demand develop differently.
The next test is a decision, not another slogan
The Federal Reserve calendar lists the next meeting for 27–28 October. The decision and accompanying communication will provide a clearer policy test. As the earlier Fed research stressed, the date of the information matters: a prior discussion cannot incorporate a later release.
Between now and that decision, the useful checklist is whether inflation pressure persists, how market-implied policy pricing changes on comparable timestamps, and whether real yields, the dollar and gold demand confirm the proposed mechanism. A change in one indicator should prompt a check of the others, not an automatic trade.
The evidence weakens a simple “inflation is cooling” narrative. It also strengthens the need to test gold’s opportunity cost. It does not, by itself, provide a direction forecast for GLD.
Which matters more for gold now: inflation protection or the return available elsewhere?
Sources and scope
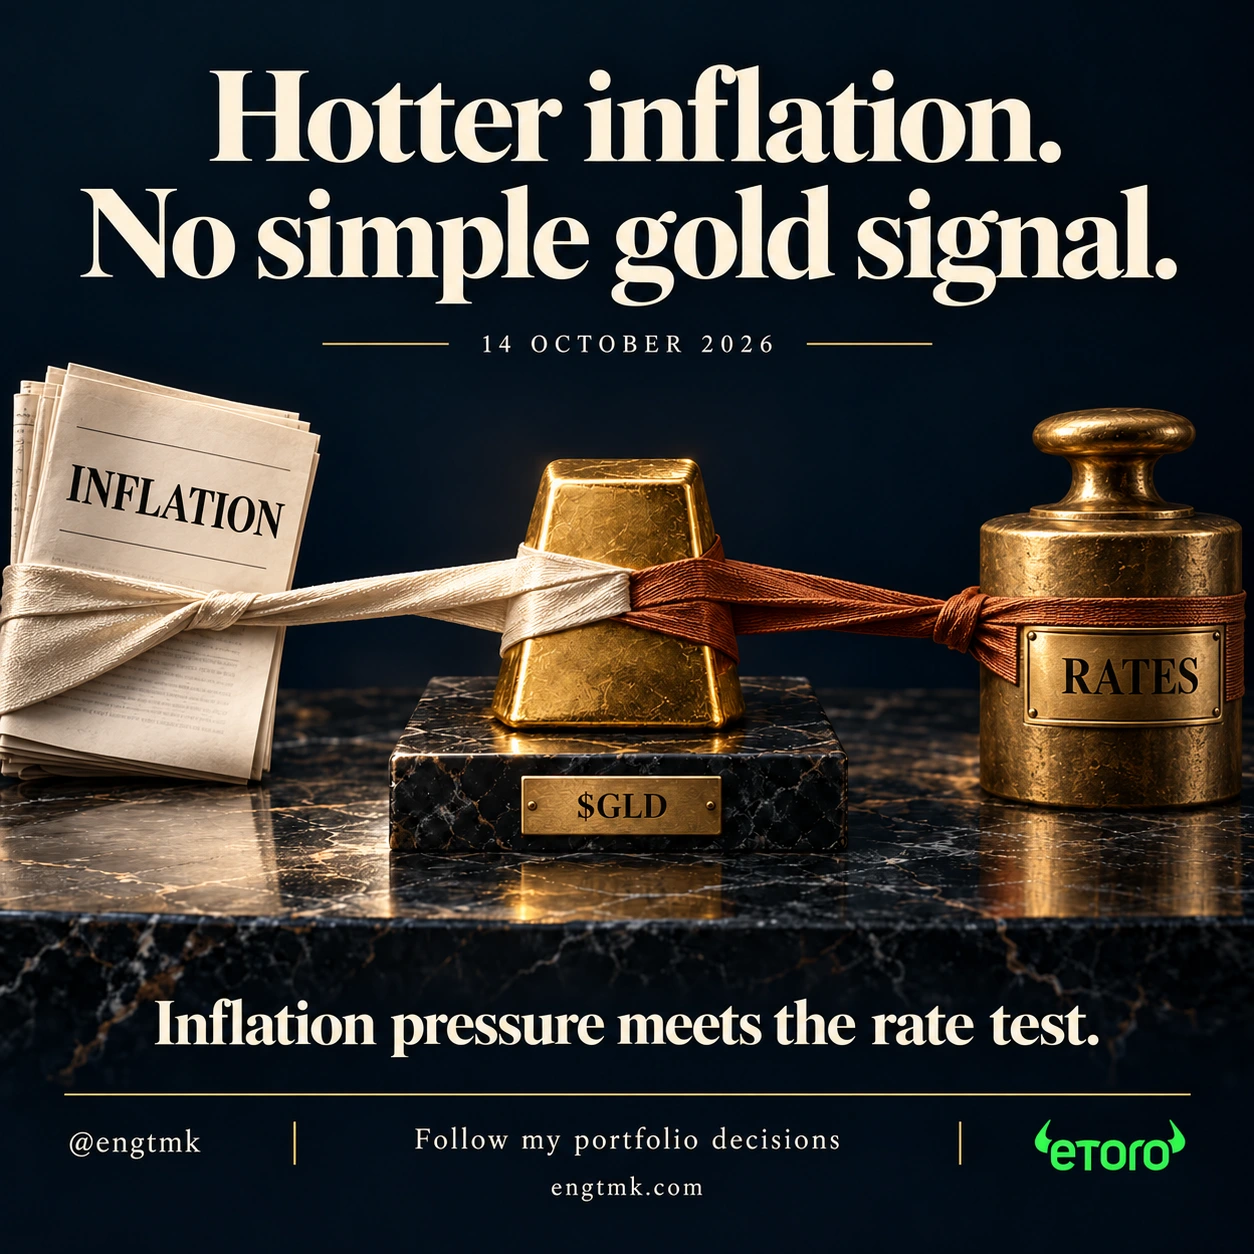
Primary CPI, Federal Reserve, CME and fund-provider sources are linked above; the World Gold Council supplies interpretive context. CPI figures refer to September, released in October. The CME snapshot is explicitly time-stamped, and calculations and scenarios are distinguished from reported facts. No current portfolio weight, transaction, performance or recommendation to change a position is asserted. The cover is conceptual, not a scaled chart or a forecast.
My portfolio and views, not investment advice.
@engtmk engtmk.com