
CPI came in cool. My calendar trick didn’t fire—and that’s the lesson.
Monday, I described a possible calendar trick.
July CPI would measure a month in which crude oil spiked during the Iran conflict, even though much of that pressure had already reversed by publication day.
The setup suggested that a hot headline could describe conditions that were no longer current.
That is not what happened.
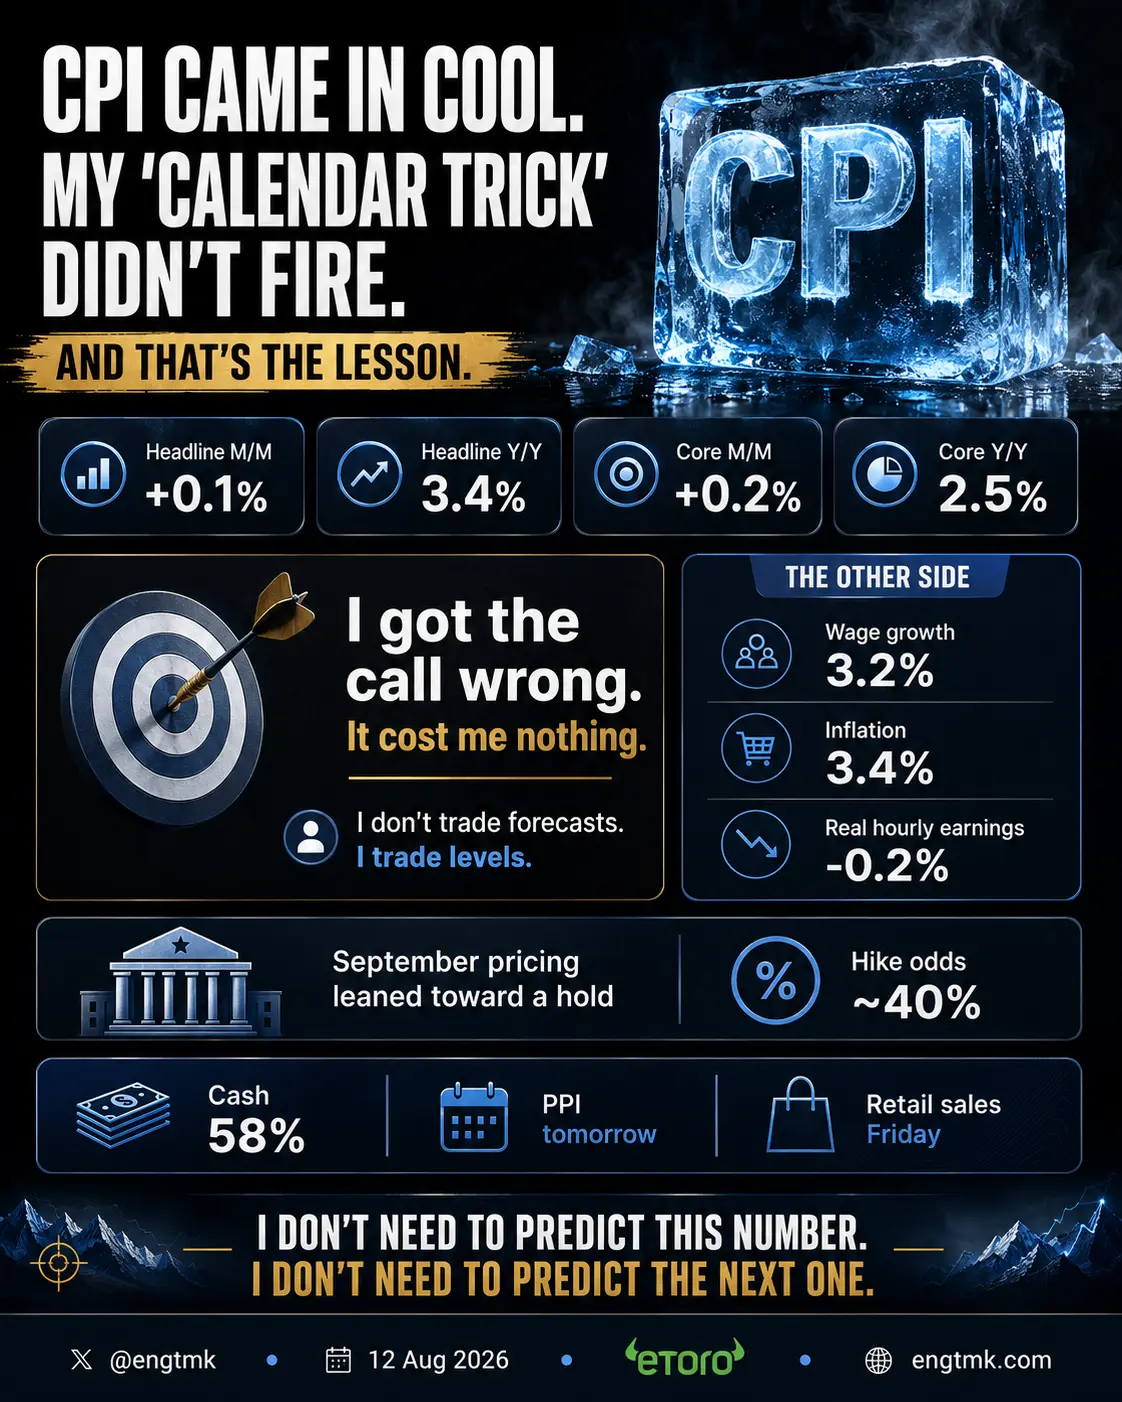
July CPI came in broadly in line with expectations:
- Headline CPI: +0.1% month over month and +3.4% year over year
- Core CPI: +0.2% month over month and +2.5% year over year
The inflation rate cooled slightly.
The calendar trick did not fire.
I got the call wrong.
It cost the portfolio nothing.
Checking the thesis
The Monday research article made a conditional argument:
July’s energy shock may raise measured inflation pressure even though part of that shock has subsequently reversed.
That sentence was deliberately narrower than “CPI will be hot.”
But my own directional expectation was still too high.
Here is the honest scorecard:
| Question | What I expected | What happened | Verdict |
|---|---|---|---|
| Could July’s oil spike lift measured energy pressure? | Yes | The CPI energy index fell 1.5% | Wrong |
| Could the report describe conditions that had since changed? | Yes | Oil timing still differed, but it did not create a hot CPI print | Mechanism existed; result did not |
| Would persistent core categories matter more than crude alone? | Yes | Shelter rose 0.1% and supplied about two-thirds of the monthly headline increase | Correct |
| Should the portfolio be positioned around the forecast? | No | No forecast trade was placed | Correct process |
The useful conclusion is not that the analysis was secretly right.
The useful conclusion is that one part of the analysis was incomplete—and the portfolio was designed to survive that fact.
What actually happened inside CPI
The all-items index rose 0.1% in July.
Shelter increased 0.1% and accounted for roughly two-thirds of the monthly increase.
Food rose 0.1%.
Energy fell 1.5%.
Gasoline fell 2.9% on a seasonally adjusted basis and 2.1% before seasonal adjustment.
Core inflation rose 0.2%, with increases in medical care, airline fares, communication, education and recreation. Motor-vehicle insurance declined.
Over twelve months:
- All-items CPI slowed from 3.5% to 3.4%
- Core CPI slowed from 2.6% to 2.5%
- Energy remained 14.7% higher
- Gasoline remained 24.6% higher
- Shelter increased 3.2%
That is a cooler monthly report inside a still-elevated annual price environment. BLS July CPI release
Why crude oil did not dictate gasoline CPI
My error was treating a real commodity signal as though the transmission into consumer prices would be fast and clean.
It was neither.
Crude oil is an input into gasoline.
It is not the retail gasoline price.
The price paid at the pump also reflects:
- Refining margins
- Regional inventories
- Distribution and transport
- Taxes
- Retail margins
- Product specifications
- Seasonal demand
- Timing between crude purchases, refining and retail sale
The CPI gasoline index then adds another layer: it measures daily retail observations across the month and reports a seasonally adjusted monthly change.
So the chain was not:
Crude rises in July → July gasoline CPI must rise.
It was:
Crude rises → pass-through depends on refining, inventories, retail pricing, timing and seasonal adjustment.
That second statement is less dramatic.
It is also more accurate.
A good mechanism can produce a wrong forecast
Oil shocks can raise consumer inflation.
That relationship is real.
But a real relationship is not the same as a reliable one-month forecast.
A forecast requires assumptions about:
- Magnitude
- Timing
- Pass-through
- Offsetting components
- Seasonal adjustment
- Expectations already embedded in the consensus
I identified one plausible driver.
I did not have enough information to know whether it would dominate July’s index.
It did not.
This is why narrative coherence is dangerous.
A chain can make economic sense and still fail because one link is weaker, slower or offset by another link.
Wrong forecast, zero portfolio cost
The scenario did not authorize a trade.
I did not short the index.
I did not reduce qualified positions.
I did not buy an inflation hedge solely because CPI might be hot.
I did not move demand zones to fit the macro story.
Cash remained around 58% because that was the portfolio state before the forecast—not because I was betting on CPI.
The levels remained unchanged because price structure had not changed.
That distinction matters.
If the forecast had been tied directly to capital, being wrong would have required a loss decision.
Because it was treated as a scenario rather than a signal, the result created information without damage.
I was allowed to be wrong because the portfolio was not required to believe me.
This is not proof that forecasting is useless
Forecasts can improve preparation.
The Monday scenario helped identify:
- Which release mattered
- Which component might create surprise
- Why a hot headline could be backward-looking
- How yields might transmit the result into equities
- Which portfolio levels would be relevant after the reaction
That preparation remains useful even though the forecast failed.
The mistake would be grading the work as either completely valuable or completely worthless based only on the outcome.
The better review separates:
- Was the mechanism plausible?
- Were the assumptions complete?
- Was the confidence calibrated?
- Was capital exposed appropriately?
- What new evidence improves the model?
The answer today is:
- Plausible mechanism
- Incomplete transmission model
- Directional expectation too strong
- Appropriate capital exposure: zero
- Clear lesson from gasoline pass-through
That is a useful failed forecast.
Cool inflation does not mean households feel relief
Markets can celebrate a softer inflation rate while households remain under pressure.
Average hourly earnings for all private nonfarm employees rose 3.2% from July 2025 to July 2026.
Headline CPI increased 3.4% over the same headline comparison.
The BLS’s formal real-earnings calculation shows real average hourly earnings fell 0.2% over the year.
Real hourly earnings also fell 0.1% from June to July.
Average weekly hours rose over the year, so real average weekly earnings increased 0.1% despite the hourly decline. BLS July real-earnings release
All three statements can be true:
- Inflation is cooling
- Prices are still rising
- Hourly purchasing power is slightly lower than a year ago
“Cool CPI” describes the change in the inflation rate.
It does not mean prices returned to their old level.
It does not mean every household experienced relief.
The Fed debate moved; it did not end
After CPI, Fed-funds futures priced roughly a 40% probability of a September hike, down from 44% before the report and 55% one week earlier.
That made a hold the more likely market outcome.
It did not remove the hike scenario. Reuters market reaction
Cleveland Fed President Beth Hammack has argued that current policy is unlikely to moderate inflation sufficiently and that tighter policy is needed.
Other officials have also made the case for hikes, while some see value in waiting for more evidence.
The disagreement is rational because the data are mixed:
- Inflation remains above 2%
- July payrolls declined
- Earlier job gains were revised lower
- July CPI cooled slightly
- Real hourly earnings remain pressured
- Energy and geopolitical risks remain unstable
There is another employment report and another CPI release before the September decision.
One cool report changed the probability.
It did not close the case.
What comes next
PPI arrives Thursday.
Retail sales follow Friday.
The useful combinations are now clearer:
Cool PPI and resilient retail sales
This would support the soft-landing story: less pipeline inflation without an obvious collapse in demand.
Hot PPI and strong retail sales
This could revive the rate-hike debate by combining price pressure with enough demand to tolerate tighter policy.
Cool PPI and weak retail sales
The inflation relief would be welcome, but the earnings question would grow.
Hot PPI and weak retail sales
This would be the least comfortable outcome: margin pressure and softer demand without an easy Fed response.
I do not need to predict which square arrives.
I need to know what each square would mean.
What I am doing
No portfolio rule changed after CPI.
Cash remains around 58%.
Existing positions remain governed by their own thesis, levels and risk limits.
The marked zones remain unchanged.
If PPI or retail sales pushes a qualified company toward a valid level, the system can evaluate the resulting price.
The calendar identifies when uncertainty may enter the portfolio.
It does not tell me which way the event will resolve.
That is the same distinction used for company earnings in Lesson 27: The earnings calendar is a risk tool, not a prediction tool.
The larger lesson
Saying “I got it wrong” is not a confession that the process failed.
Pretending the forecast was right would be the process failure.
The Monday thesis produced a plausible scenario.
Wednesday produced contrary evidence.
The correct response is to update the model:
- Crude oil is not retail gasoline
- Pass-through is neither immediate nor guaranteed
- Seasonal adjustment matters
- One visible driver may not dominate the index
- Macro scenarios should prepare decisions, not bypass entry rules
The forecast failed.
The risk architecture did its job.
I did not need to predict this number.
I do not need to predict the next one.
Being wrong is inevitable. Paying heavily for every wrong opinion is optional.
This is a record of my process and opinions, not investment advice. I hold positions in securities mentioned or related. Copy trading involves risk, including loss of capital. Past performance is not an indication of future results.