
The AI exposure hiding inside a diversified portfolio
I watched Patrick Boyle’s breakdown of what an AI crash could destroy.
It did not make me want to sell anything.
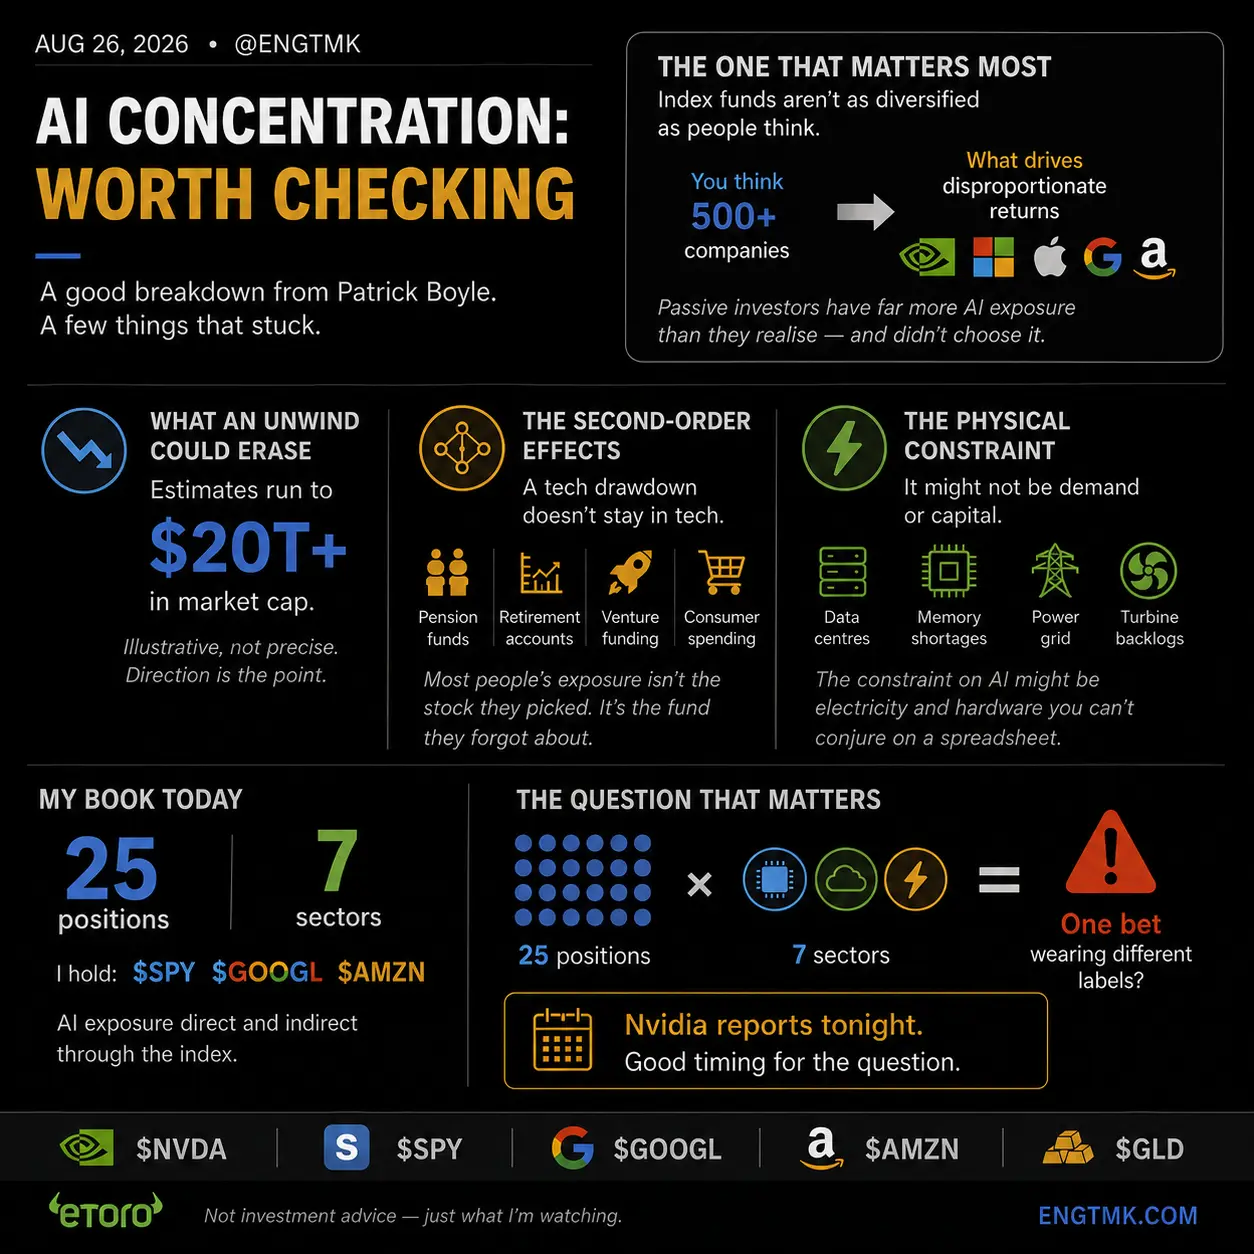
It made me want to inspect something more useful: how much of my portfolio is one AI bet wearing different labels?
That question matters more now because my August deployment took cash from roughly 58% to 20%. I hold 25 positions across seven sectors, including SPY, and recently added Alphabet and Amazon.
On a position-count screen, the portfolio looks diversified.
On a factor screen, the answer is less obvious.
The concentration claim survives the fact-check
SPY gives me ownership of more than 500 companies. It does not give each company the same influence.
The S&P 500 is weighted by float-adjusted market capitalization. The largest businesses therefore drive much more of the index than the smallest ones.
As of August 25, State Street reported that SPY’s ten largest constituents represented approximately 37.2% of the index. Nvidia alone was 7.81%. Amazon was 3.87%, and Alphabet’s two share classes together represented another 5.54%. State Street SPY holdings
That means Amazon and Alphabet accounted for about 9.4% of SPY before counting my direct positions in either company.
S&P Dow Jones Indices has described this as an unusually concentrated period: by mid-2025, the ten largest S&P 500 companies were already close to 40% of the index, a level not seen since the mid-1960s. S&P Dow Jones Indices research
So the precise lesson is not that an index fund is undiversified. SPY still spreads company-specific risk across hundreds of businesses.
The lesson is that company count and economic exposure are different measurements.
A capitalization-weighted index can be broad by name count and concentrated by return driver at the same time.
What the $20 trillion number can—and cannot—tell us
Boyle’s video discusses estimates running into the tens of trillions of dollars of potential wealth destruction in a severe AI unwind.
I would not treat $20 trillion—or any similarly exact figure—as a forecast.
The answer changes dramatically depending on:
- Which companies are classified as AI-linked
- The starting valuation date
- The assumed drawdown
- Whether the calculation covers U.S. equities or global assets
- How much of the fall spreads into other sectors
- Whether private-market marks, credit and consumer spending are included
The figure is useful as a scenario scale. It is not a price target for a crash.
There is also a crucial counterargument: concentration is evidence of exposure, not proof of a bubble.
The largest AI-linked companies are not pre-revenue dot-com shells. Microsoft, Amazon, Alphabet and Nvidia have produced substantial operating revenue and profit. Recent earnings also showed that the market can reward heavy AI spending when the receipts appear in cloud growth, margins and cash generation.
The risk is not simply that AI fails.
The risk is that future returns fall short of the growth and profitability already embedded in the largest weights.
How an AI repricing could leave technology
A large technology drawdown would begin in share prices, but the transmission would not necessarily stop there.
First order: direct holdings and index funds
The obvious losses would sit in Nvidia, hyperscalers, semiconductor suppliers and other companies priced on the AI investment cycle.
The less obvious losses would appear inside broad funds. A passive investor does not need to own Nvidia separately to be exposed to Nvidia. SPY already supplies that exposure according to its weight.
Second order: retirement wealth and spending
Index funds sit inside pensions, retirement accounts and ordinary brokerage portfolios. A broad decline therefore reduces household financial wealth, not only the paper value of specialist technology funds.
The exact consumer response is uncertain and differs across households. But the wealth-effect channel is real: Federal Reserve research has historically estimated that changes in stock-market wealth affect subsequent consumption, while newer Fed work notes that the effect is weaker when wealth is concentrated among higher-income households. Federal Reserve research on stock wealth and spending, Federal Reserve research on wealth heterogeneity
That is why a technology repricing can eventually reach retailers, travel, housing and other businesses with no AI label.
Third order: funding and capital expenditure
Lower public valuations can make private funding harder, reduce the value of equity compensation and raise the proof required for the next data-centre project.
If hyperscalers protect cash flow by slowing capital expenditure, the effect can move through contractors, electrical equipment, storage, memory and power generation.
This is the hidden factor: several sectors can depend on the same capital-spending decision.
The physical constraint cuts both ways
Boyle also raises a point that financial models can underweight: AI is not only software and capital. It requires chips, memory, data centres, electricity, grid connections and generation equipment.
The International Energy Agency projects global data-centre electricity consumption to more than double to around 945 terawatt-hours by 2030. In the United States, data centres are expected to account for nearly half of electricity-demand growth through 2030. IEA Energy and AI
The bottlenecks are visible in company disclosures. Micron has described surging AI-driven demand for memory and storage, while GE Vernova said its first-half 2026 Electrification data-centre orders exceeded $5 billion—more than double the full-year 2025 total. Micron, GE Vernova
That constraint has two possible investment consequences.
It can be bearish if unavailable power and hardware delay deployment, raise costs and reduce the return on AI capital.
It can be bullish for scarce suppliers if demand stays strong, pricing holds and backlogs convert into profitable revenue.
So “the grid is constrained” is not a complete thesis. The questions are who captures the scarcity economics, who must pay for them and how long the bottleneck lasts.
Looking through my own portfolio
My August deployment note said the next test was whether 25 holdings across seven sectors would actually move differently when the headlines arrived.
This is the deeper version of that test.
Based on the positions I have publicly disclosed, the AI exposure appears in several layers:
| Exposure layer | Examples in my book | Shared driver |
|---|---|---|
| Direct platforms | GOOGL, AMZN, MSFT | AI adoption, cloud demand, monetization and capital returns |
| Broad-index overlap | SPY | Large-cap weights, including Nvidia, Amazon, Alphabet and Microsoft |
| Physical infrastructure | PWR, GEV, FIX | Data-centre construction, grid investment and power availability |
| Hardware and testing | STX, APH, JBL, KEYS, TER | Server, storage, electronics and semiconductor investment cycles |
| Different macro exposures | GLD, healthcare and consumer holdings | Rates, geopolitics, clinical execution and household demand |
This does not mean every name will move together every day.
It means sector labels can hide a shared earnings driver. A utility contractor and a cloud platform may sit in different sectors while both depend partly on the same AI infrastructure cycle.
It also means I cannot calculate a credible “AI percentage” from ticker count alone. That requires current position weights, SPY’s look-through weights and a decision about how much of each company’s economics genuinely depends on AI.
Any single number would contain judgment disguised as precision.
The more useful test is a stress map:
- Which holdings depend directly on AI revenue?
- Which depend on hyperscaler capital expenditure?
- Which are duplicated through SPY?
- Which should behave differently if the AI spending cycle slows?
- Is their combined portfolio weight consistent with the loss I am willing to absorb?
That is the practical version of Lesson 24: Diversification is not a position count.
What Nvidia can answer tonight
Nvidia reports fiscal second-quarter results today at 2 p.m. Pacific time. Nvidia Investor Relations
The report cannot tell us whether an AI crash is coming.
It can update the evidence underneath the concentration:
- Data-centre demand and its durability
- The pace of new-system deployment
- Supply and memory constraints
- Gross margins and cash conversion
- Whether customers are still expanding orders fast enough to support the infrastructure chain
A strong report would not remove concentration risk. A weak report would not prove the entire AI thesis is broken.
Either result would change the receipts available to support the prices.
What I am doing
Nothing on the back of one video.
I am not selling SPY, Alphabet or Amazon before Nvidia reports. I am not adding a crash hedge because a large scenario number sounds frightening.
I am doing the more useful work: looking through the index, tagging shared drivers and judging the portfolio by economic exposure rather than the number of rows on the screen.
My cash level is around 20%, so this review matters more than it did a month ago. The portfolio has less unused capacity and more sensitivity to whether its diversification is real.
That is not a reason to override the system.
It is a reason to understand what the system now owns.
Twenty-five positions can be diversified.
Twenty-five positions can also be one bet wearing different labels.
The difference is not the count.
It is what makes them move.
This is a record of my process and opinions, not investment advice. I may hold positions in securities mentioned or related. Copy trading involves risk, including loss of capital. Past performance is not an indication of future results.