
The week inflation cooled—and oil started climbing again
Three major economic reports arrived this week.
All three were soft.
- CPI: +0.1% month over month and +3.4% year over year; core CPI rose 0.2% monthly and 2.5% annually
- PPI: unchanged in July, with final-demand prices up 4.7% over twelve months
- Retail sales: −0.6% in July, the first decline in nine months and the largest in fourteen months
Markets liked the inflation part of that combination.
The S&P 500 closed Thursday at a record 7,798.99 after reaching 7,816.70 intraday.
Then the live backdrop changed again.
The UAE said two vessels owned by ADNOC were attacked while crossing the Strait of Hormuz on Thursday evening. Oil moved higher on Friday as shipping risk returned.
That leaves the week with two different pictures:
July data showed easing price and demand pressure. August began adding new energy risk.
Both matter.
They should not be collapsed into one forecast.
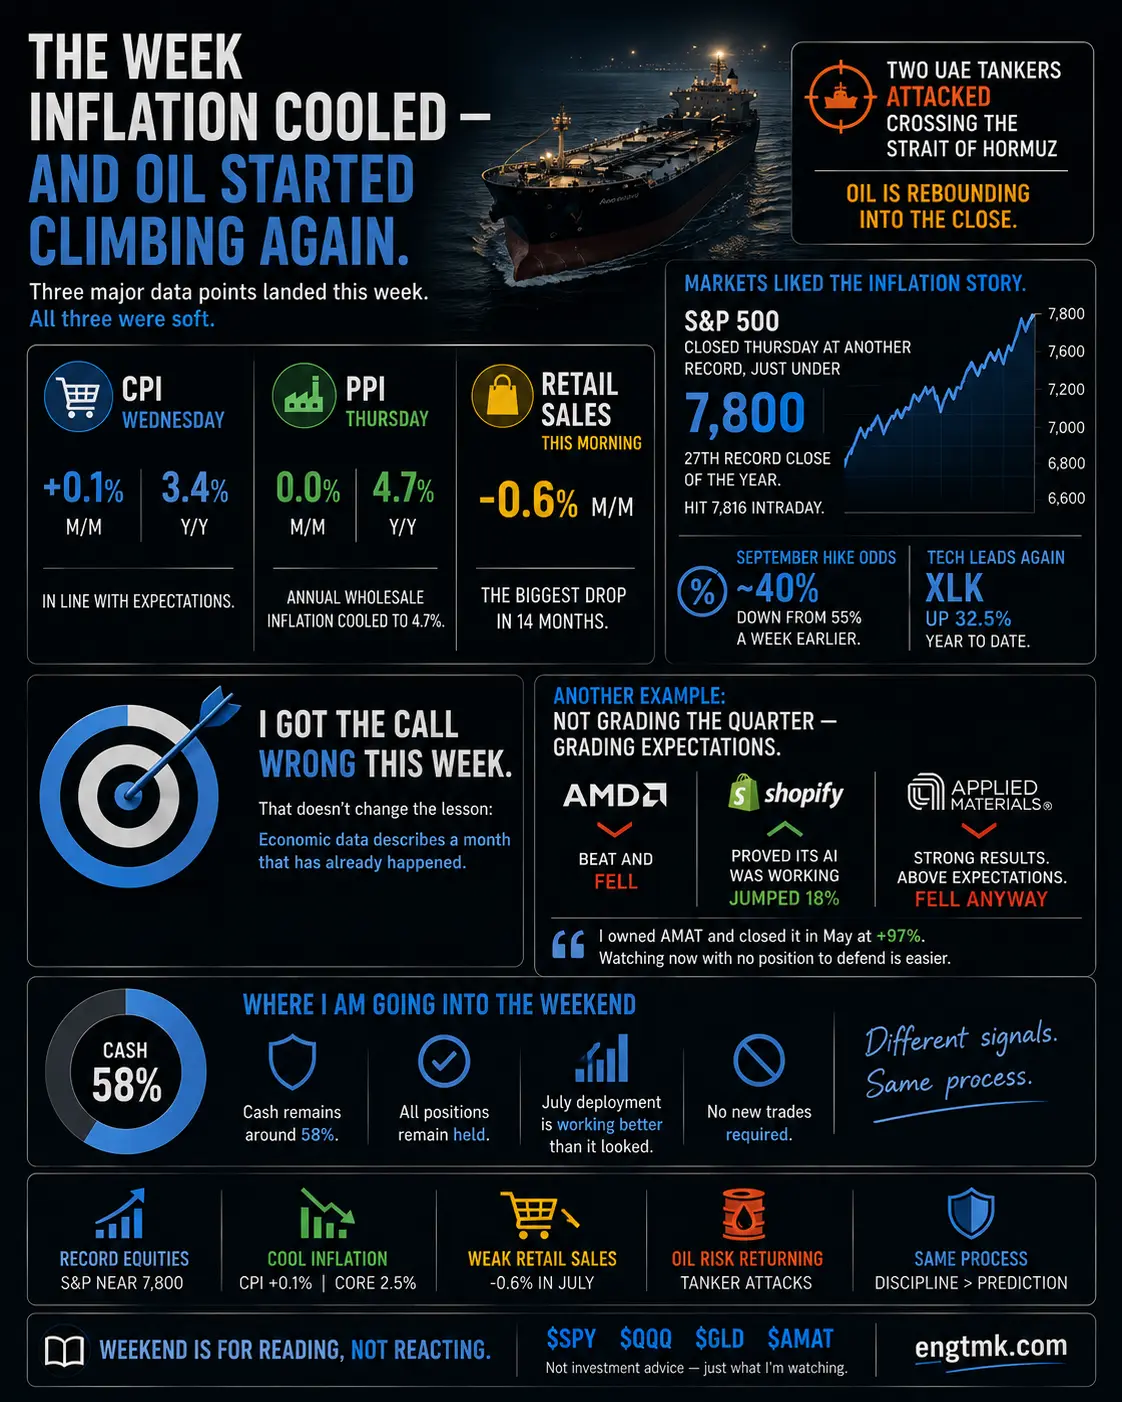
The week in three releases
Wednesday’s CPI report showed that consumer inflation rose only 0.1% in July.
Energy fell 1.5% and gasoline fell 2.9% on a seasonally adjusted basis. Core inflation rose 0.2%, while the annual core rate eased to 2.5%. BLS July CPI release
Thursday’s producer-price report extended the disinflationary signal.
The final-demand index was unchanged as a 0.2% rise in services and a 2.2% increase in construction were offset by a 0.7% fall in goods. The twelve-month rate was still 4.7%, so “flat” did not mean wholesale prices were low. It meant the index did not increase during July. BLS July PPI release
Friday’s retail-sales report supplied the weaker-demand side of the story.
Advance sales fell 0.6% from June to $763.6 billion. June’s increase remained 0.2%. Sales excluding autos fell 0.3%, while the control group used in GDP calculations declined 0.4%. U.S. Census Bureau July retail-sales release
The headline decline was broad enough to deserve attention, but it needs two qualifications.
First, retail sales are nominal. The report measures dollars spent, not inflation-adjusted consumption.
Second, it is an advance estimate based on a sample and subject to revision.
So −0.6% is evidence that July spending softened.
It is not, by itself, proof that the consumer has broken.
The same data can help markets and hurt households
Markets often welcome softer demand because it can reduce inflation pressure and make tighter monetary policy less likely.
Households experience the same data differently.
The BLS reported that real average hourly earnings fell 0.2% from July 2025 to July 2026. Real hourly earnings also declined 0.1% during July, although longer hours left real average weekly earnings slightly positive over the year. BLS July real-earnings release
That creates a split interpretation:
- Investors see softer inflation and lower policy risk
- Consumers may see purchasing power and discretionary spending under pressure
- Companies may see easier input costs but weaker unit demand
All three can be true.
“Good for rates” is not identical to “good for earnings.”
The line matters because bad economic news can support valuations only while it remains mild enough that future profits are still credible.
Checking Monday’s calendar thesis
On Monday, I wrote that inflation week contained a calendar trick.
July’s reports would describe a month when crude oil had spiked, even though energy conditions had already changed by publication day.
Wednesday provided the first correction: the hot CPI scenario did not occur.
I scored that forecast plainly. Gasoline CPI fell despite the crude move. The transmission mechanism was more complicated than the directional thesis implied.
Friday provided the more durable version of the argument.
Economic releases are dated twice:
- The date they are published
- The period they actually measure
The release date is current.
The observation period is not.
This week told us that consumer prices, producer prices and retail spending were softer in July.
It did not promise that August would follow the same path.
Oil risk returned after the data were collected
The UAE accused Iran of attacking two ADNOC-owned vessels in the Strait of Hormuz on Thursday night. No injuries were reported, and ADNOC said the situation was under control. Shipping traffic through the strait remained far below normal as tension rose. Reuters on the attacks and Reuters on Friday’s shipping conditions
Oil edged higher Friday.
The market now has to hold two facts at once:
- July energy prices helped produce a cooler monthly inflation report
- August energy and transport risk may be rising again
The second fact does not guarantee a hot August CPI.
I learned this week why that inference is too aggressive.
Crude must pass through refining, inventories, distribution, retail pricing and seasonal adjustment before it appears in consumer gasoline data. Other CPI components can offset it.
The correct conclusion is conditional:
A sustained oil increase would add inflation risk. One attack and one session do not determine next month’s index.
That is a scenario to monitor, not a trade instruction.
Applied Materials: another good quarter that was not good enough
Applied Materials supplied a company-level version of the same timing problem.
The company reported record fiscal-third-quarter revenue of $9.12 billion, up roughly 25% from a year earlier. Adjusted earnings exceeded consensus, and its fourth-quarter revenue midpoint of $10.25 billion was above Wall Street’s estimate.
The shares still fell.
The explanation was not that the report was bad.
It was that the evidence did not clear the expectation embedded in a strongly performing semiconductor-equipment stock. Investors focused on its relative growth pace, competitive comparisons and margins—not merely whether the published numbers beat consensus. Reuters on Applied Materials’ reaction
AMD did the same thing last week after record revenue.
Shopify did the opposite after showing AI-linked growth that exceeded what buyers had priced.
The recurring rule is:
The market is not grading the quarter. It is grading the quarter against the price paid before the quarter arrived.
I owned Applied Materials previously and closed the position in May at roughly +97%.
Watching the report now without a position is useful.
There is no entry to justify, no profit to protect and no forecast to defend.
That distance makes it easier to separate business evidence from price emotion.
What the portfolio did this week
The July deployment is working better than it looked immediately after entry.
Several positions that began underwater have moved positive.
That does not prove the deployment caught the bottom.
It was not designed to.
The positions were opened at partial size, spread across different business drivers and backed by substantial unused capital. They had room to absorb an uncomfortable first move without forcing a decision.
Cash remains around 58%.
No new trades were required this week.
Existing holdings remain governed by their individual theses, risk limits and marked levels.
The portfolio did not need one unified view on CPI, retail sales, oil, Iran or Applied Materials.
That is the point.
Different signals need different jobs
This week’s information belongs in separate parts of the process:
| Signal | What it informs | What it does not authorize alone |
|---|---|---|
| Cool CPI | Current inflation trend and rate sensitivity | Buying equities at any price |
| Flat PPI | Pipeline price pressure and margin context | Declaring inflation defeated |
| Weak retail sales | Demand and earnings risk | Calling a recession from one advance estimate |
| Higher oil risk | Scenario stress for inflation and margins | Predicting the next CPI print |
| AMAT reaction | Expectations embedded in semiconductor valuations | Buying merely because results beat |
The discipline is classification.
Data can update the environment without replacing the entry rules.
What I am doing
I am keeping the same posture going into the weekend.
- Cash remains around 58%
- The July positions remain held under their existing plans
- Marked levels remain unchanged
- Oil risk is being monitored, not forecast into an order
- Applied Materials is being evaluated without a position
If new information pushes a qualified company toward a valid zone, the system can examine the price then.
Until that happens, activity would add motion—not necessarily edge.
The larger lesson
The portfolio’s job is not to predict every signal correctly.
It is to survive conflicting signals without demanding an emotional answer.
Cool inflation can coexist with weak purchasing power.
Weak retail sales can support rate hopes while raising earnings questions.
Record equities can coexist with geopolitical energy risk.
A company can beat expectations and still fail the price’s higher test.
A useful system has room for all of those statements.
That leads to the final question in Portfolio Architecture: what is the portfolio ultimately being built to fund?
Lesson 28: How much is enough? turns that objective into a financial-independence range rather than a performance slogan.
Different signals.
Same process.
Weekend is for reading, not reacting.
This is a record of my process and opinions, not investment advice. I hold positions in securities mentioned or related. Copy trading involves risk, including loss of capital. Past performance is not an indication of future results.