
Why tech can fall when oil rises
Technology companies do not need to consume much oil for an oil shock to hurt their share prices.
That sounds contradictory only if the analysis stops at the income statement.
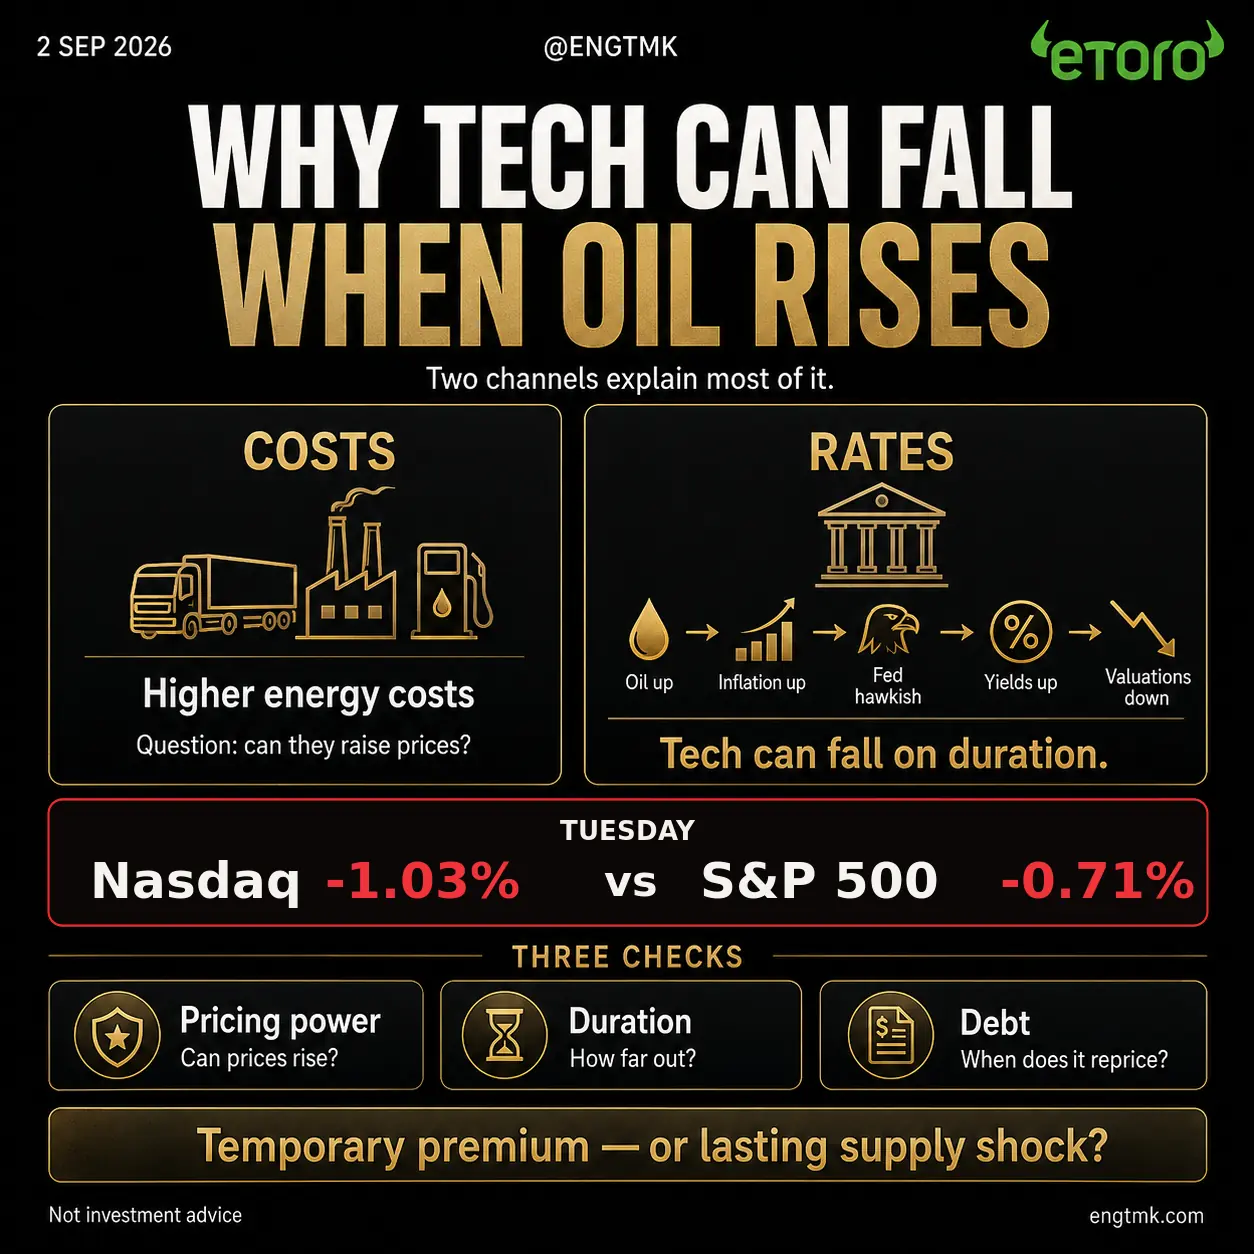
Oil reaches equities through two main channels. The first is direct: higher fuel, freight and feedstock costs compress margins. The second is financial: higher oil can keep inflation sticky, alter the expected path of monetary policy and raise the discount rate applied to future profits.
The second channel is why a company with little direct oil exposure can still fall when crude rises.
The question this week is not simply whether oil is up. It is whether the price contains a temporary geopolitical premium or is beginning to reflect a lasting loss of physical supply.
First, correct the tape
Monday did not show technology underperforming the broad market. On 31 August, the Nasdaq Composite fell 0.12% while the S&P 500 fell 0.33%.
Tuesday provided the cleaner example. The Nasdaq fell 1.03%, compared with 0.71% for the S&P 500, as crude prices and sovereign-bond yields rose. The Philadelphia semiconductor index lost 2.1%, while energy was the strongest S&P 500 sector.
That pattern is consistent with the duration channel. It is not proof that oil alone caused every move. Geopolitics, positioning, economic data and the normal repricing of individual companies were operating at the same time.
The rate backdrop also changed materially after Federal Reserve Chair Kevin Warsh’s Jackson Hole speech. Fed-funds futures moved from a 36% probability of a September increase before the remarks to 58% immediately after them. By Tuesday, CME pricing implied approximately a 68.2% probability of a 25-basis-point increase, up from 39.6% a week earlier.
Those probabilities are market prices, not promises about what the Fed will do. Their value here is that they show the direction in which the discount-rate assumption moved.
Sources: Monday’s market close, Tuesday’s market close, and post–Jackson Hole rate pricing.
Channel one: the operating-cost shock
The direct channel reaches the companies that buy fuel, energy-intensive inputs or transportation.
Airlines see it in jet fuel. Transport companies see it in diesel and surcharges. Chemicals businesses can face higher feedstock and process-energy costs. Packaging becomes more expensive through resin, manufacturing and freight. Retailers can feel the pressure in distribution networks, imported goods and household demand.
The relevant question is not merely whether a cost rose.
It is whether the company can pass that cost through before it damages unit demand and margins.
| What to inspect | Stronger position | Weaker position |
|---|---|---|
| Contract structure | Indexed pricing or fuel surcharges | Fixed prices with immediate cost exposure |
| Customer need | Essential or hard-to-replace product | Discretionary and easily substituted product |
| Margin structure | High gross margin and room to absorb volatility | Thin margin with little buffer |
| Pass-through timing | Prices reset quickly | Costs rise long before selling prices |
| Demand elasticity | Customers tolerate higher prices | Volume falls when prices move |
Pricing power does not mean a company can raise prices without consequence forever. It means the business can preserve enough revenue and margin while the shock moves through the system.
There is also a consumer channel inside this mechanism. More household spending on fuel leaves less for discretionary purchases. That can hurt a retailer even if the retailer’s own energy bill is small.
Channel two: the discount-rate shock
The broader path runs through inflation and interest rates:
Higher oil → firmer inflation expectations → a more hawkish policy path → higher yields → lower present value for distant cash flows.
Growth shares are often described as long duration because more of the valuation depends on profits expected years from now. When the discount rate rises, those distant profits lose more present value than cash flows arriving today.
That is a valuation effect, not a claim that the underlying company suddenly sells fewer products.
It also explains why the immediate share-price response can be much larger than the direct change in operating costs. A small move in the assumed discount rate touches every future year in a valuation model.
The chain is conditional, however. Oil does not automatically force the Fed to hike. Policymakers will care about the shock’s persistence, its pass-through into broader prices, inflation expectations, wages and demand. A brief risk premium that reverses may leave much less policy damage than a durable shortage.
The third check is debt
Duration is not only an equity-valuation issue.
Companies with debt maturities approaching may have to refinance at higher rates. That changes interest expense and can reduce cash available for investment, acquisitions or buybacks.
The headline debt balance is therefore incomplete. I want to know:
- How much debt is fixed-rate versus floating-rate?
- When do the largest maturities arrive?
- What rate was paid on the debt being replaced?
- Does free cash flow cover the refinancing burden?
- Are capital spending plans optional, or necessary to protect the business?
A company with a large debt balance but long, fixed maturities can be less exposed to an immediate rate shock than a lightly indebted company facing a near-term refinancing wall.
Three checks for every holding
The same framework can be applied across the portfolio without pretending every stock has the same oil sensitivity.
| Check | Question | Evidence that matters |
|---|---|---|
| Pricing power | Can higher costs be passed through without losing demand? | Gross-margin trend, contract resets, surcharges, volume and management commentary |
| Duration | How much of today’s valuation rests on distant profits? | Free-cash-flow timing, valuation sensitivity and the response to real yields |
| Debt | When does financing reprice? | Maturity schedule, fixed/floating mix, interest coverage and refinancing spreads |
An airline is likely to feel the first channel quickly. A highly valued software or platform company may feel the second even if its own fuel bill is trivial. A capital-intensive company can face both operating costs and refinancing pressure.
Sector labels are not enough. The AI concentration review reached the same conclusion from a different direction: holdings with different labels can still share one economic factor.
Temporary premium or lasting supply shock?
This is the thesis that deserves tracking.
Preliminary Kpler data showed only four commodity vessels transited the Strait of Hormuz on Tuesday, down from 10 on Monday and below the recent 10-day average of about 13. One vessel entered and three exited. Reuters also cautioned that the count can change because some vessels switch off their transponders.
That is very different from approximately 40 confirmed commodity crossings. More importantly, even an accurate vessel count would not settle the supply question by itself.
A ship count is not a barrel count. Vessel size, cargo status, direction, loading schedules and delayed AIS data all matter.
Source: Reuters on Hormuz commodity traffic.
| Scenario | What the evidence would look like | Likely market mechanism |
|---|---|---|
| Temporary risk premium | Transit recovers, freight and insurance costs ease, inventories remain adequate | Oil premium and inflation fear can unwind quickly |
| Friction without major lost supply | Ships continue moving, but delays and insurance costs stay high | Uneven margin pressure; volatility persists without a full shortage |
| Durable physical loss | Loadings and export volumes fall, inventories draw, the futures curve tightens | Lasting earnings pressure and a stronger inflation/rates channel |
The variables I want to watch are physical loadings and cargo volumes, freight and war-risk insurance, inventory changes, refinery demand and the shape of the oil futures curve.
Headlines describe risk. Those indicators help show whether barrels are actually disappearing from the market.
What would disprove the stronger thesis?
The strongest version of the bearish case says higher oil becomes persistent inflation, forces tighter policy and damages both corporate margins and long-duration valuations.
That case weakens if:
- Hormuz traffic and export loadings normalize
- Inventories do not draw materially
- Freight and insurance premia retreat
- Inflation expectations remain anchored
- Yields reverse despite the oil move
- Companies preserve margins without sacrificing volume
Conversely, the thesis strengthens if physical exports fall, the prompt futures curve tightens, inflation expectations rise and earnings guidance begins to show cost or demand damage.
The distinction keeps the analysis falsifiable. A high oil price is not, by itself, proof of lasting supply loss.
What I am doing
I am not rearranging the portfolio because of one headline or one down session.
I am rechecking each holding through pricing power, duration and debt, then watching whether the physical evidence confirms the market’s inflation concern.
That is especially important after August reduced cash to roughly 20%. The month-end deployment baseline means the portfolio now has more exposure to any common macro factor.
The open question belongs on Checking the Thesis:
Is oil carrying a temporary risk premium, or is the market beginning to price a lasting loss of physical supply?
The answer will not come from the next headline.
It will come from the flow of ships, barrels, inventories, yields and company margins.
Watch the transmission, not only the price.
This is a record of my process and opinions, not investment advice. I hold positions in securities mentioned or related. Copy trading involves risk, including loss of capital. Past performance is not an indication of future results.